
Steam Game Analysis
2022
TL;DR
Steam is the biggest place to buy PC games and it sits on a mountain of data about what sells, almost none of which is public. The numbers you find online contradict each other. So I scraped it myself. 150,000+ games, pulled one slow request at a time, and used that data to estimate the things Steam doesn’t tell you.
A few numbers that fell out, all my own estimates. Roughly 1.49 billion Steam accounts, about $20.89 spent per account, and somewhere around $3.69 billion that Steam has made from its cut of sales. Then I built a model to rank every game by whether it made more or less money than you’d expect. Full ranked list here.
Getting the data the hard way
I figured this part would take an afternoon. There’s no public Steam database and no official stats, and every third-party number online disagreed with the next. Steam does have an API, but the parts I needed aren’t documented, so a lot of the early work was poking at endpoints to see what came back.
The first call returns the full list of games, which turned out to be over 150,000 of them. For each one I pulled its details (price, genres, categories, platforms, release date) and its review breakdown (positive, negative, the score). The API is rate-limited and won’t take a flood of requests, so you have to wait a few seconds between each one. At 150,000 games that adds up. I had my PC running this around the clock for a few days and had to restart it a few times when batches came back corrupted, which I never fully diagnosed.
Inventing the numbers Steam won’t give you
Steam tells you reviews, not sales. But if you know what fraction of buyers leave a review, you can work backwards from review counts to rough sales.
To get that fraction I needed the total number of Steam accounts, which Steam also doesn’t publish. So I used a site that tells you whether the nth Steam account exists, and probed account numbers until I’d narrowed down the count. About 1.49 billion accounts at the time I pulled the data. Across all 150,000 games there were roughly 67.6 million reviews total, which works out to about 4.55% of accounts leaving a review.
From there it cascades. Review count plus that 4.55% gives an estimate of copies sold. Copies times price gives revenue. And since Steam takes a 30% cut, a bit less once a game passes $10 million in sales, I could estimate Steam’s take. Somewhere around $3.69 billion from that cut alone, and about $20.89 spent per account.
None of these are official. They’re estimates stacked on estimates, and if the 4.55% is off then everything downstream is off with it. But they’re grounded in real scraped numbers rather than someone’s guess in a forum post.
Figuring out what “performance” even means
The question I wanted to answer was which games made more or less money than they should have. That needs an expected revenue for each game to compare against the real number. Beat your expected revenue, you overperformed. Miss it, you underperformed.
Getting that expected number took three tries.
First I figured review positivity would do it, on the theory that better-liked games just make more money. Plotting it killed that immediately. Positivity and revenue barely relate, and the cloud of points is mostly noise.
Next I tried averaging revenue by tag. Take the average revenue of every genre and category, then blend the tags on a given game into a prediction. That was much worse, off by around 600% on a log scale, which is roughly six orders of magnitude. Comically bad, and I don’t think I ever worked out exactly why it went that wrong rather than just somewhat wrong.
So I gave in and trained a model, which I’d been avoiding because it pulls away from the data-science side I wanted to stay on. I fed it the features I had. Price, review positivity, age, genres, categories, game type, and supported platforms. That finally gave a believable expected revenue for each game.
The result
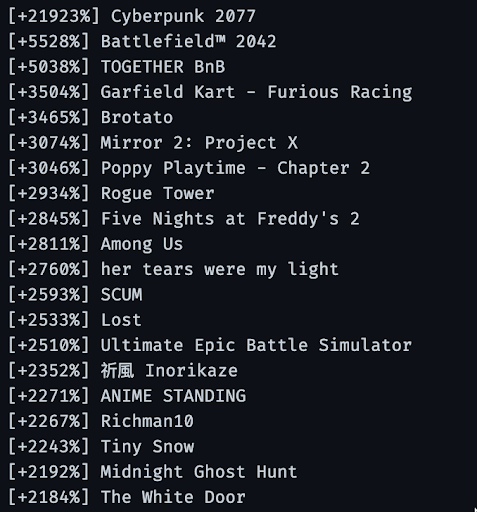
With the model done, I ranked all 150,000 games by how far they beat or missed their expected revenue.
The biggest overperformers are almost all hype games. Cyberpunk 2077 tops the list at around +21,923%, with Battlefield 2042, Among Us, and Five Nights at Freddy’s not far down. That makes sense once you think about what the model can and can’t see. It knows a game’s price, genre, and reviews. It has no idea a game went viral or got caught up in a trend. So the games that overperform their stats are the ones that blew up for reasons no feature in my dataset could capture. The full ranked list is here.
What most of the work actually was
Almost none of this project was analysis.
The data didn’t exist, so I scraped it. Then the sales numbers didn’t exist either, so I estimated them from a chain of smaller facts I could measure. And when the clean ways to score performance didn’t work, I kept going until something did.
Getting messy, missing, real-world data into a shape where a question could even be asked took maybe 80% of the time. That ratio surprised me then. It doesn’t anymore.